Education, Child Protection & TVET · Reporting Period: Apr–Jun 2026 (Q7)




Key achievements through June 2026 across Education, Inclusive Support, and Child Protection components.
Cumulative performance against MYRP II indicators through June 2026 (Q7).
| # | Sector | Level | Indicator | Target | Reached | % | Female | F% |
|---|---|---|---|---|---|---|---|---|
| 1 | ED | Outcome | Adolescents (10–18) enrolled in NFE iCumulative count of unique adolescents (10–18) enrolled in non-formal education programs across all cohorts and locations. Same counting methodology for Q6 and Q7. | 5,000 | 6,689 | 133% | 4,261 | 63.7% |
| 1.b | ED | Outcome | Retention rate by grade/level iStudents retained at end of academic period ÷ students enrolled at beginning × 100. Disaggregated by grade and level. Same methodology for Q6 and Q7. | 75% | 83.1% | 111% | 67.7% | — |
| 1.1.1 | ED | Output | OOS adolescents enrolled in schools iCumulative count of out-of-school adolescents newly enrolled in formal schools. Disaggregated by sex and disability status. Same counting methodology for Q6 and Q7. | 1,200 | 571 | 47.6% | 434 | 76% |
| 1.1.2 | ED | Output | At-risk adolescents staying enrolled iCumulative count of students identified as at-risk (academic, economic, or protection concerns) who remain actively enrolled. Includes all compensatory education students. Same methodology for Q6 and Q7. | 3,800 | 7,409 | 195% | 4,826 | 65.1% |
| 1.1.3 | ED | Output | Average attendance rate iHow it's calculated: Students achieving at least 70% attendance ÷ total enrolled × 100. Q7: 1,689 / 2,244. | 70% | 75.27% | 107.5% | 78.02% | — |
| 1.1.4 | CP | Output | CwD receiving assistive devices iCumulative count of children with disabilities provided with assistive devices and learning aids tailored to their specific needs. Disaggregated by sex. Same methodology for Q6 and Q7. | 150 | 84 | 56% | 52 | 62% |
| 1.2.1 | ED | Output | OOS enrolled in secondary schools iCumulative count of OoS adolescents enrolled in secondary programs, including exam-centre candidates supported across 5 national exam centres. Q7 figure as reported in RF — under verification. Same counting methodology for Q6 and Q7. | 160 | 35,152 * | 21,970% | 17,927 | 51% |
| 1.2.2 | ED | Output | Transition rate primary → secondary iStudents successfully transitioning from primary to secondary ÷ total students completing the primary cycle × 100. Same methodology for Q6 and Q7. | 60% | 71% | 118% | 91.8% | — |
| 1.2.4 | ED | Output | Schools with accessibility features iCount of schools where accessibility modifications (ramps, adapted sanitation, accessible pathways) have been installed and are functional. Same methodology for Q6 and Q7. | 4 | 7 | 175% | — | — |
| 1.2.5 | ED | Output | Children benefitting from accessibility iCount of children enrolled in schools where accessibility features are in place, benefitting from an accessible and inclusive learning environment. Same methodology for Q6 and Q7. | 813 | 1,597 | 196% | 1,034 | 65% |
| 1.3.1 | CP | Output | Young mothers enrolled iCumulative count of young mothers (girls who have given birth) enrolled in NFE or literacy programs. Disaggregated by location. Same methodology for Q6 and Q7. | 112 | 79 | 71% | 79 | 100% |
| 1.3.2 | CP | Output | Early-married women enrolled iCumulative count of early-married women enrolled in NFE or literacy programs. Disaggregated by location. Same methodology for Q6 and Q7. | 140 | 212 | 151% | 212 | 100% |
| 1.3.3 | CP | Output | Children of young mothers in ECCD iCumulative count of children of enrolled young mothers placed in Early Childhood Care & Development programs. Same methodology for Q6 and Q7. | 56 | 100 | 179% | 42 | 42% |
| 1.3.6 | CPED | Output | Learning spaces with DRR measures iCount of learning spaces where DRR systems — emergency plans, safety drills, firefighting kits, first-aid supplies — are established and functional. Same methodology for Q6 and Q7. | 12 | 20 | 167% | — | — |
| 1.3.7 | CP | Output | Children covered by DRR plans iCount of children enrolled in learning spaces covered by active school safety / DRR plans. Includes all compensatory education students. Disaggregated by sex and disability. Same methodology for Q6 and Q7. | 3,800 | 6,118 | 161% | 3,827 | 62.6% |
| 1.4.1 | CP | Output | Community mobilization (men & women) iCumulative count of community members (men and women) engaged in mobilization activities promoting OoSC (re-)enrolment. Disaggregated by sex. Same methodology for Q6 and Q7. | 1,080 | 702 | 65% | 441 | 63% |
| 1.4.3 | CP | Output | Women in community committees iCumulative count of women actively participating in child protection networks or community protection committees. Same methodology for Q6 and Q7. | 216 | 98 | 45.4% | 98 | 100% |
| 2.1 | ED | Output | Students in remedial education iCumulative count of students enrolled in compensatory / remedial education classes across all cohorts and locations. Same counting methodology for Q6 and Q7. | 3,800 | 6,118 | 161% | 3,827 | 62.6% |
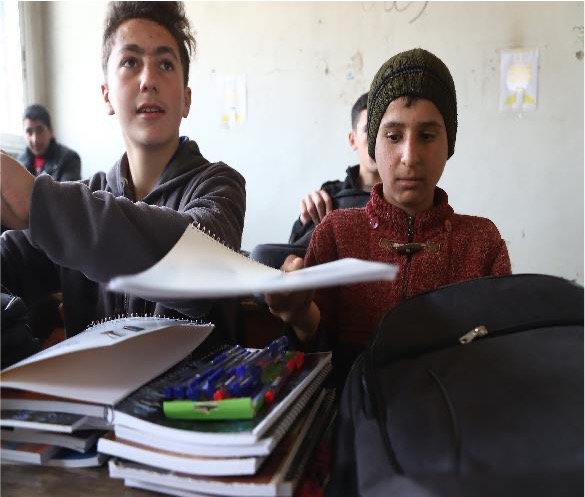
| 2.1 | ED | Output | Students receiving learning materials iCumulative count of students who received stationery kits and learning materials during the reporting period. Counted per beneficiary, not per item. Same methodology for Q6 and Q7. | 10,800 | 7,055 | 65.3% | 4,587 | 65% |
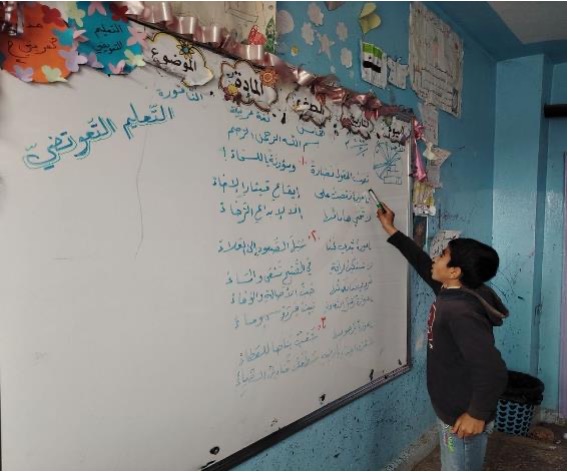
| 2.1 | ED | Output | Classrooms with TLM iCount of classrooms equipped with teaching and learning materials (TLMs) including whiteboards, textbooks, and supplementary supplies. Same methodology for Q6 and Q7. | 144 | 258 | 179% | — | — |
| 2.2 | Gender | Output | Teachers trained on gender-responsive content iCumulative count of teachers who completed training on gender-responsive pedagogy, safe school practices, and GBV prevention. Disaggregated by sex. Same methodology for Q6 and Q7. | 144 | 259 | 180% | 178 | 68.7% |
| 2.2 | ED | Output | Teachers trained on technical/inclusive pedagogies iCumulative count of teachers trained on MHPSS integration, multigrade teaching, and overcrowded classroom management techniques. Disaggregated by sex. Same methodology for Q6 and Q7. | 144 | 260 | 181% | 148 | 56.9% |
| 2.3 | CP | Output | MHPSS learning spaces iCount of learning spaces where structured MHPSS activities (PSS sessions, recreational activities, group support) are regularly implemented. Same methodology for Q6 and Q7. | 56 | 67 | 120% | — | — |
| 2.3 | CP | Output | MHPSS beneficiaries iCumulative count of children who received psychosocial support through structured MHPSS activities in learning spaces. Disaggregated by sex and disability. Same methodology for Q6 and Q7. | 35,274 | 25,950 | 73.6% | 14,305 | 55% |
| 2.5 | ED | Output | School heads trained on inclusive practices iCumulative count of school directors and heads who completed training on inclusive education management and leadership practices. Same methodology for Q6 and Q7. | 12 | 22 | 183% | 12 | 55% |
| 3 | FSL | Outcome | TVET beneficiaries (vocational programs) iCumulative count of beneficiaries who completed or are enrolled in TVET vocational training programs. Disaggregated by sex. Same methodology for Q6 and Q7. | 200 | 29 | 14.5% | 19 | 65.5% |
| 3.4 | FSL | Output | Digital literacy trainees iCumulative count of trainees enrolled in digital literacy sessions across programme locations. Disaggregated by sex. Same methodology for Q6 and Q7. | 45 | 21 | 46.7% | 12 | 57.1% |
| 4.3.1 | Coord | Output | Joint monitoring visits with education stakeholders iCumulative count of joint monitoring and school support visits conducted with local education authority stakeholders. Same methodology for Q6 and Q7. | 36 | 10 | 27.8% | — | — |
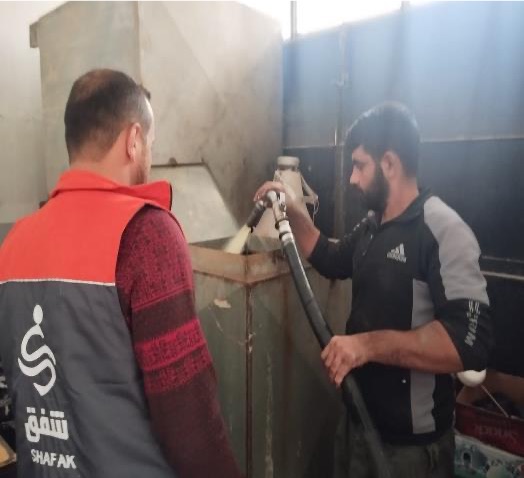
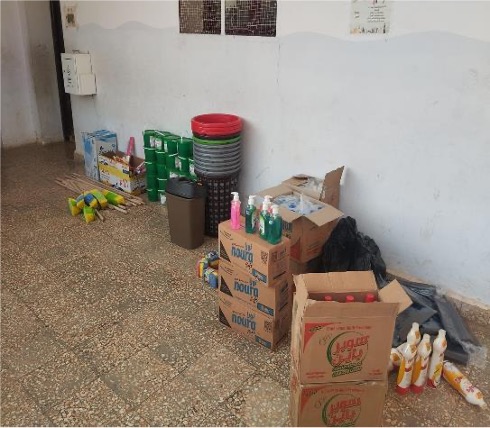
Heating fuel, potable water, power supply & hygiene items — ensuring safe learning through winter.
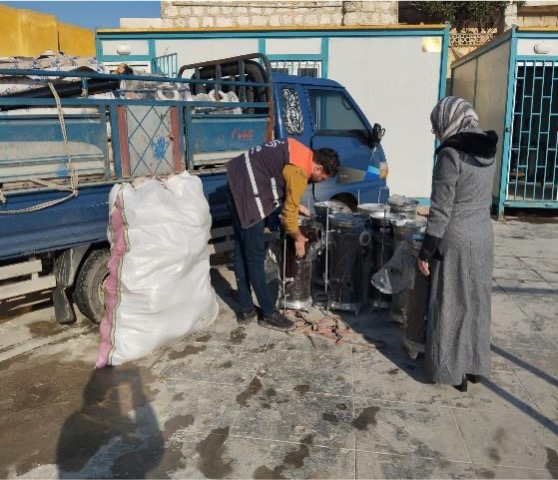
Classroom supplies & hygiene items distributed to 20 schools across three cohorts.
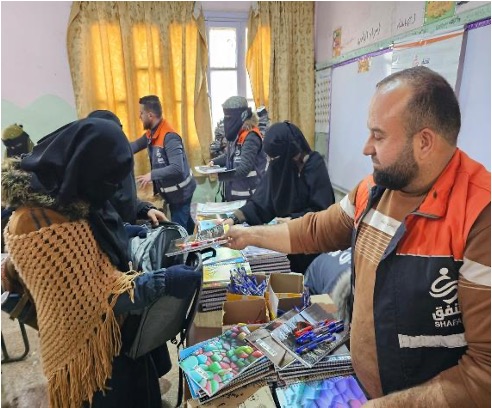
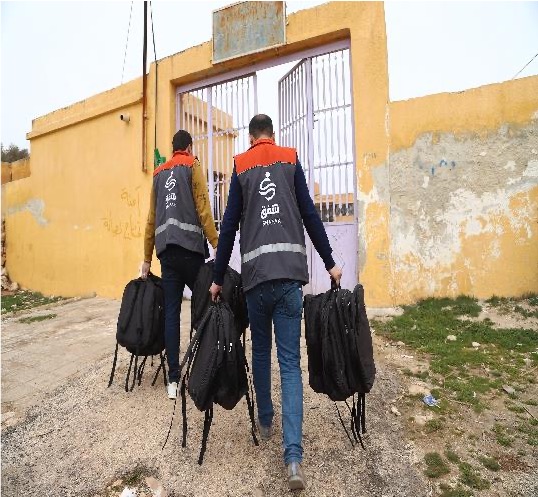
7,055 stationery kits (4,587 girls, 65%) distributed — reducing household financial barriers to education.
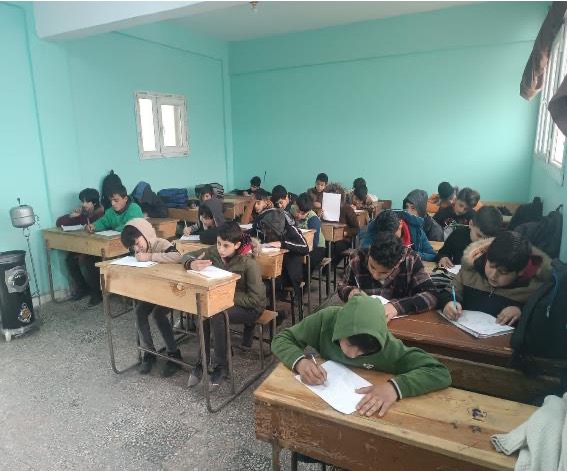
Intermediate level: Assessed in Arabic, English, Mathematics, and Science.
Secondary level — Scientific track: Arabic, English, Mathematics.
Secondary level — Literary track: Arabic, English, Philosophy.
6,118 students in remedial classes + 571 in Accelerated Learning Program across cohorts 1, 2 & 3.
20 learning spaces (167% of target) equipped with emergency plans, fire extinguishers & first-aid kits.
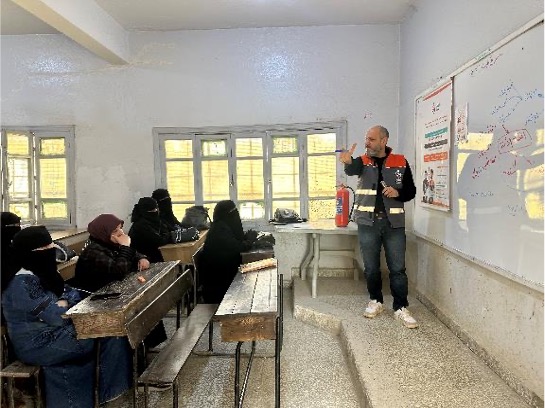
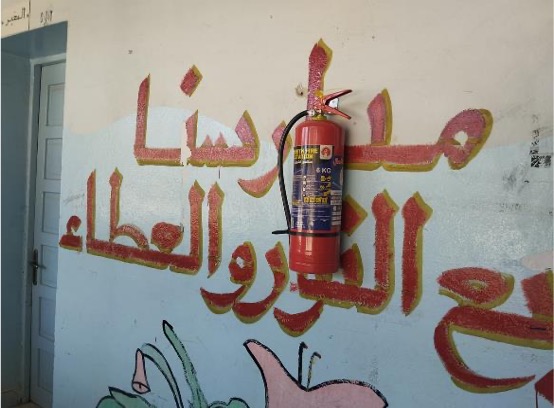
41 fire extinguishers + 24 first-aid kits · Emergency plans co-developed with PTAs · Staff & PTAs trained on fire suppression techniques
34 fire extinguishers + 33 first-aid kits · Emergency plans updated in all schools · 8 new + 4 continuing schools from previous round
Ensuring no child is left behind — assistive devices, young mothers, ECCD, and community mobilization across all three cohorts.
84 children with disabilities (52 girls, 32 boys) received assistive devices; 258 classrooms equipped with TLMs.
702 men and women mobilized to promote (re-)enrolment of out-of-school children in all their diversity.
Competency-based training, peer coaching, and school governance structures strengthening quality education delivery.
Cohort 1 (Summer 2025) & Cohort 2 (Nov–Dec 2025) — same 3-package competency curriculum with 95–99% improvement rates.
Followed by classroom observation, coaching, and peer-to-peer sessions to ensure practical application of skills.
Teacher Learning Committees (TLCs):
Parent-Teacher Associations (PTAs):
22 school heads trained; 10 community learning events across Idleb, Dana, Ma'aret Tamsrin, and Kafr Takharim.
Psychosocial support, case management, and protection referral systems across all ECW-supported learning spaces.
25,950 children reached across 67 learning spaces — structured, goal-oriented, evidence-informed, tailored to sub-groups.
195 teachers trained on CSG/PSEA; 1,282 on MHPSS support, multigrade teaching, and overcrowded classes.
Phase 1 of vocational training successfully completed March 2026 in Ariha and Ma'arrat Misrin. Two tracks delivered based on labour market assessment and youth preferences.
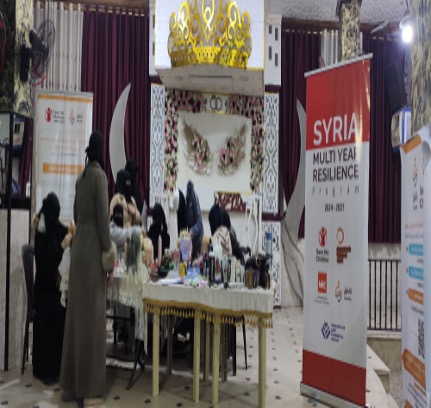
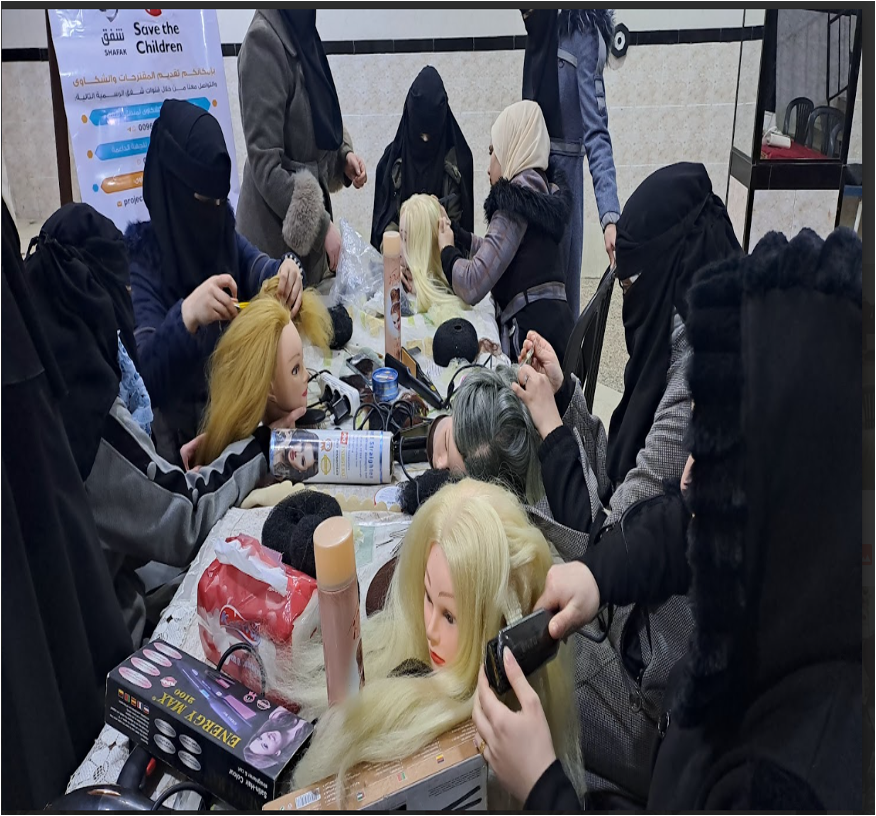
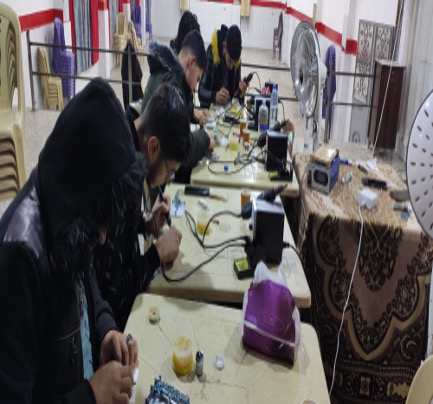
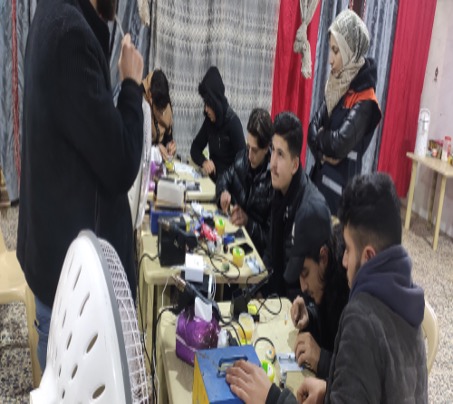
Delivered using SCI curricula — Children's Resilience Program & Girls Decide. Building confidence and decision-making skills.
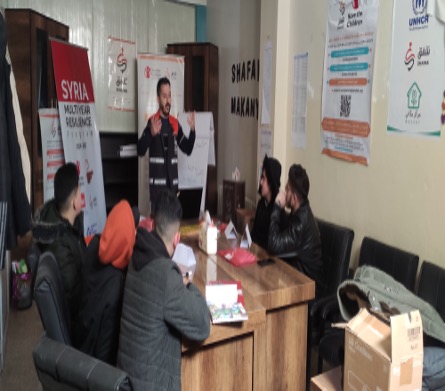
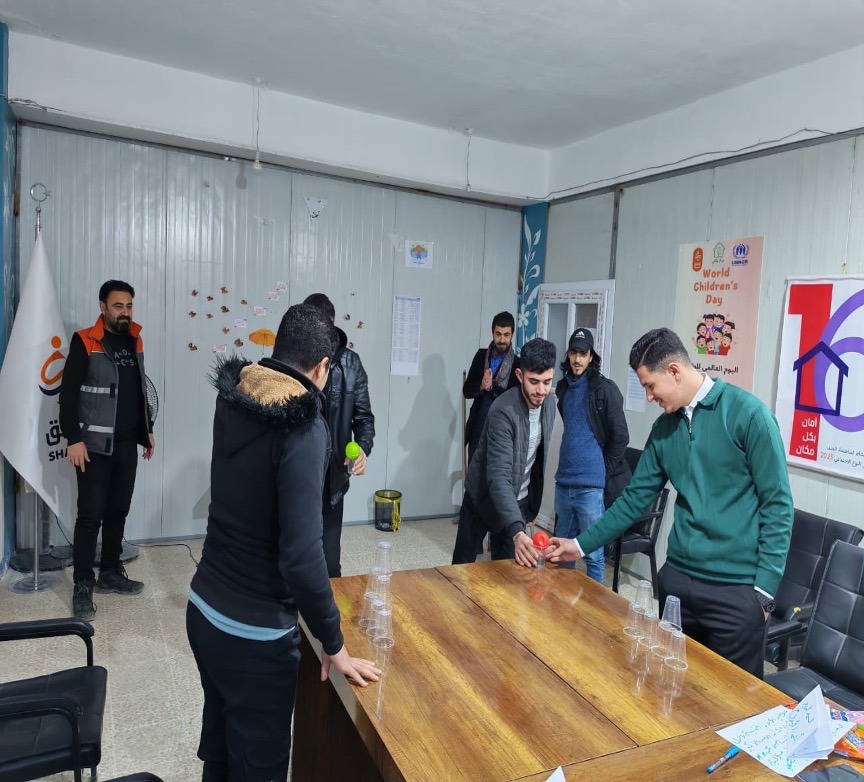
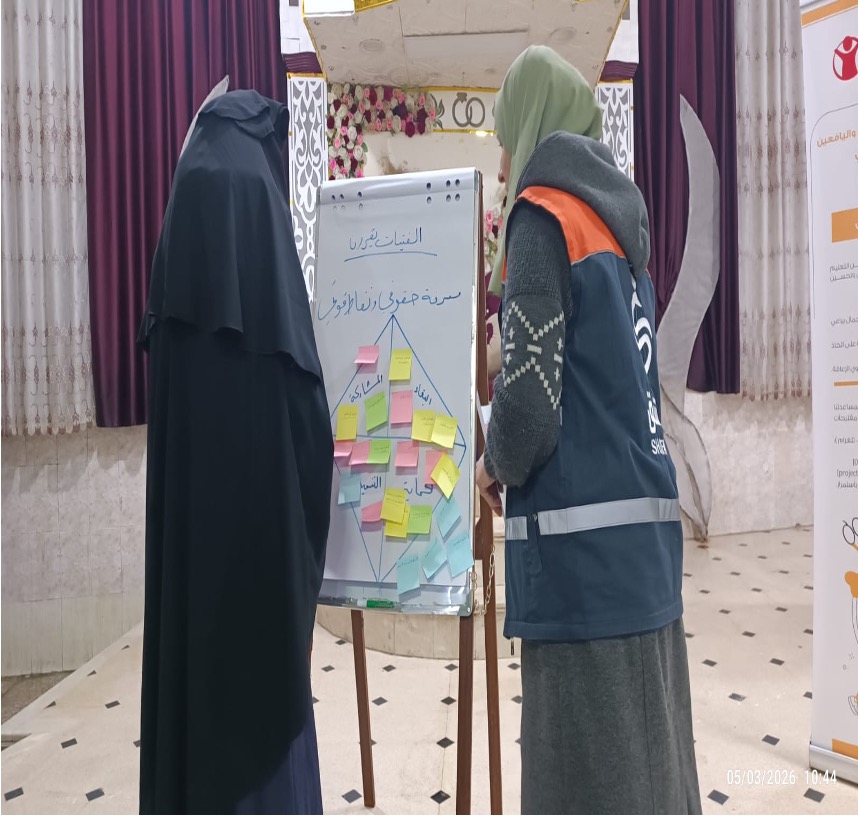
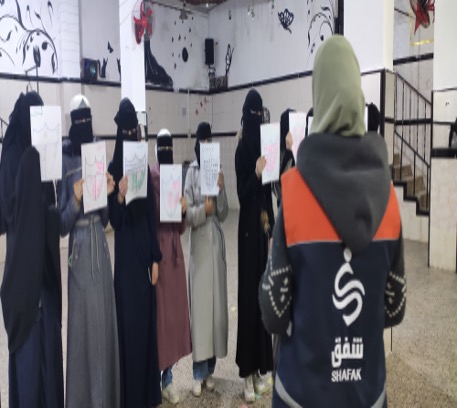
11 top performers (5M, 6F) developing business plans. Viable plans supported with cash grants to start income-generating activities.
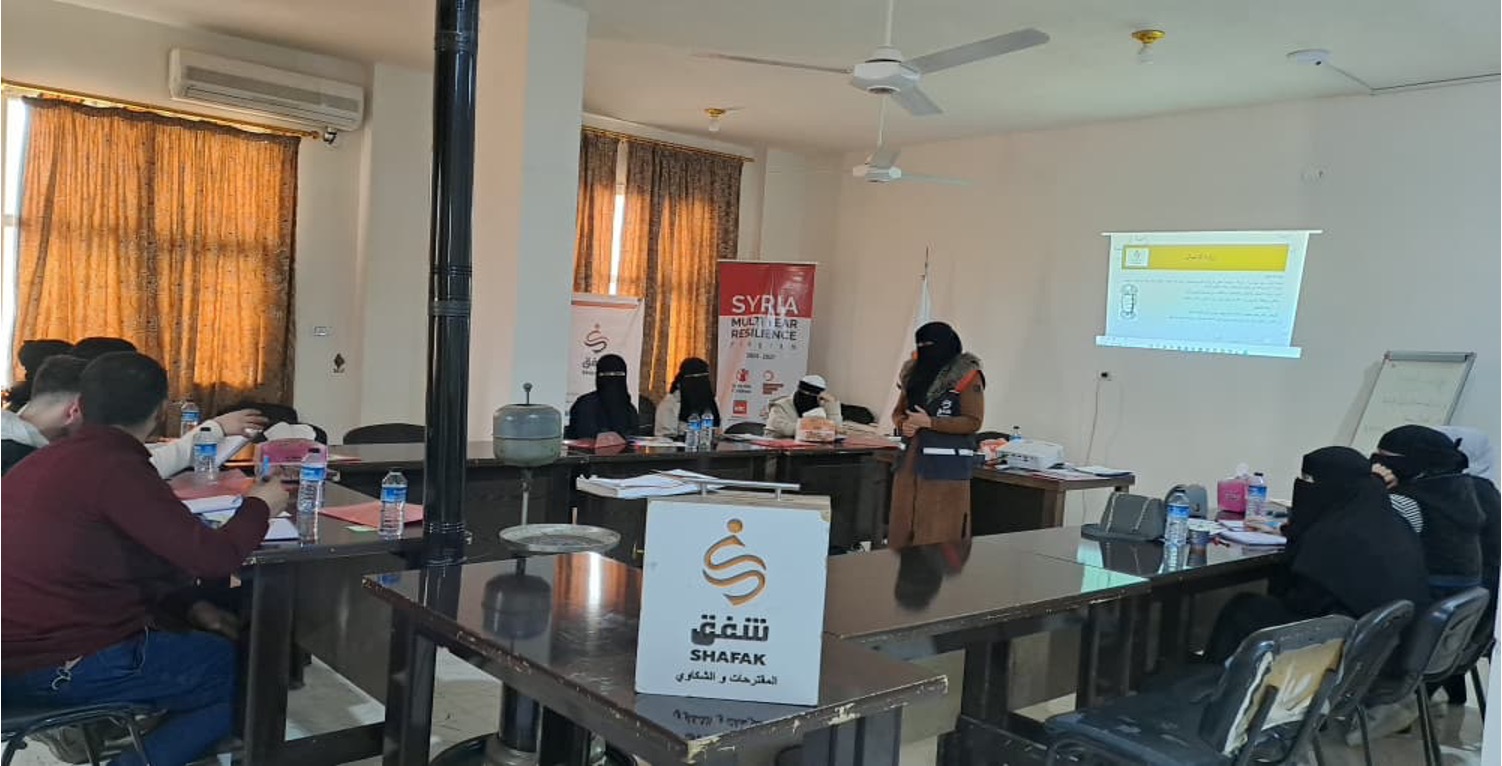
18 graduates (5M, 13F) in final preparation for 60-day workplace placements — mobile maintenance workshops & hairdressing salons.
21 trainees (9M, 12F) completed digital literacy training — sessions strengthened digital tools for employment & business development.
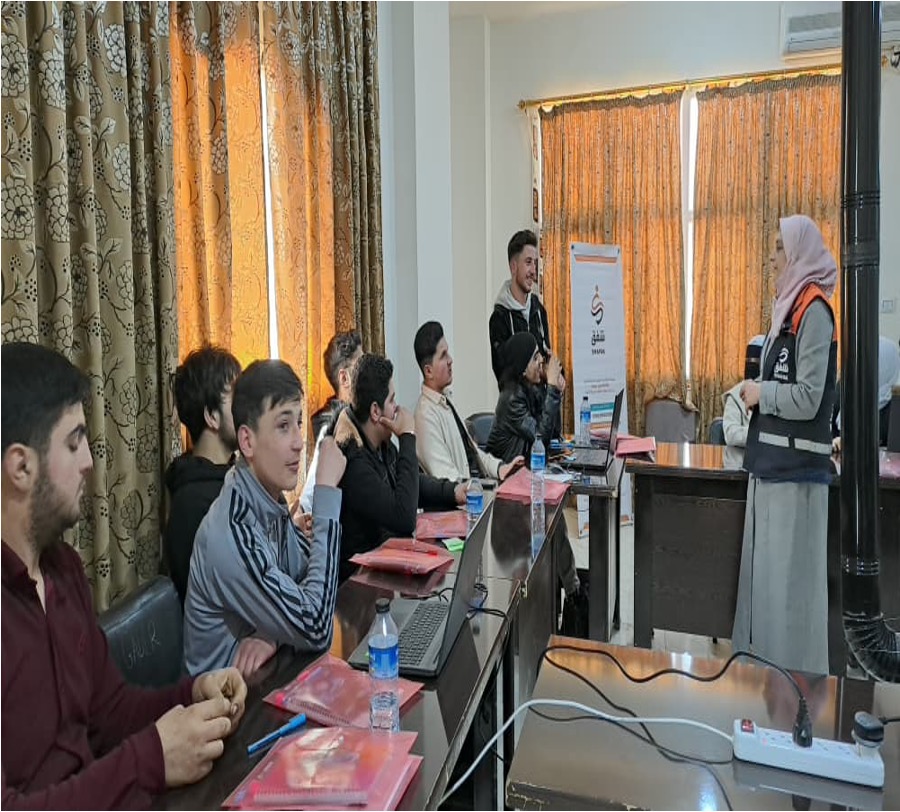
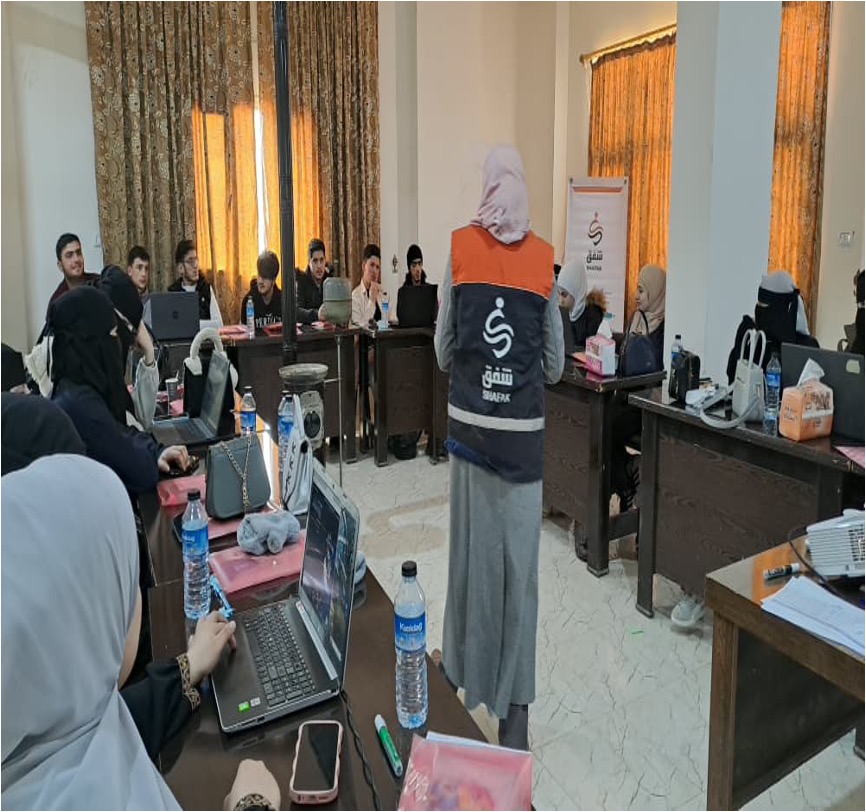
Registration for TVET Phase 2 through June 2026, including the eligible beneficiary list.
Once the final data and analysis results are received, Shafak will immediately proceed with verification and cross-checking with the relevant Directorates of Education to ensure full compliance with the agreed cases (drop-out of school).
Following completion of the verification process, we will finalize the beneficiary lists and proceed with the remaining preparatory steps in line with the planned implementation schedule.
Total financial reports shared with SCI through May 2026. No over- or under-spending anticipated.
| Category | Budget | Spent | Remaining | Burn Rate |
|---|---|---|---|---|
| Programmatic Costs | $3,353,655 | $702,079 | $2,651,576 | 20.4% |
| Support Costs | $656,246 | $270,069 | $386,177 | 41.2% |
| Capacity Building | $40,099 | $211 | $39,888 | 0.5% |
| TOTAL | $4,050,000 | $972,359 | $3,077,640 | 24.0% |
$428,020 — Received Dec 10, 2025
$377,381 — Submitted Apr 18, 2025 · Pending
$424,454 — Submitted Jul 10, 2025 · Pending
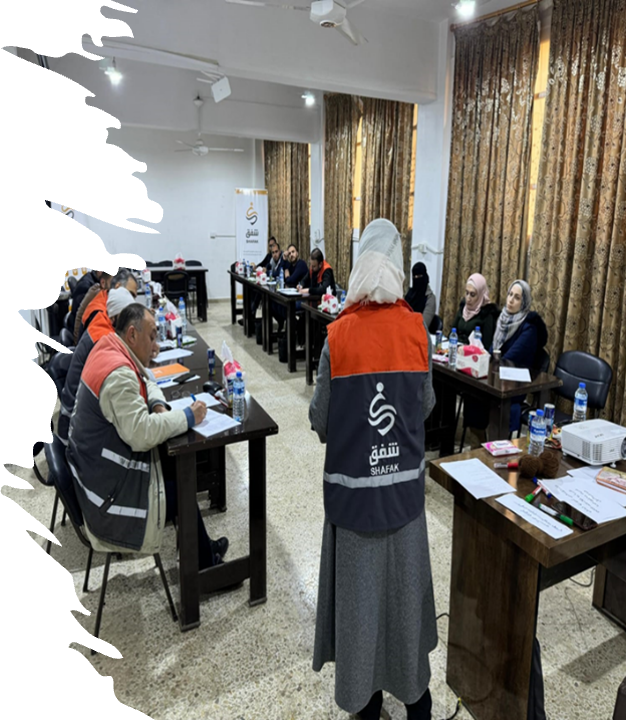
OOS indicators remain underachieved. Shafak will closely coordinate with the Education Directorate to identify new schools in areas with high concentrations of returnees to improve outreach and enrolment.
High numbers expected to return to original villages at end of 2025–26 academic year, creating retention challenges. Ministry of Education's decision on single-shift non-formal schools may require replacing some currently targeted schools.
Output-level CwD data is required for accurate reporting. The current Kobo data collection link only reflects cumulative CwD totals — not output-specific — limiting disaggregated reporting. Coordination ongoing with SCI MEAL focal points.
End-line of HALDO assessment collected for Cohort 3 — awaiting results from assessment team.
Syria Multi-Year Resilience Program II · 2024–2027
Shafak Organization · Implemented with Save the Children International · Funded by Education Cannot Wait